The editors at Best Degree Programs decided to research the topic of: The Business of Running for President
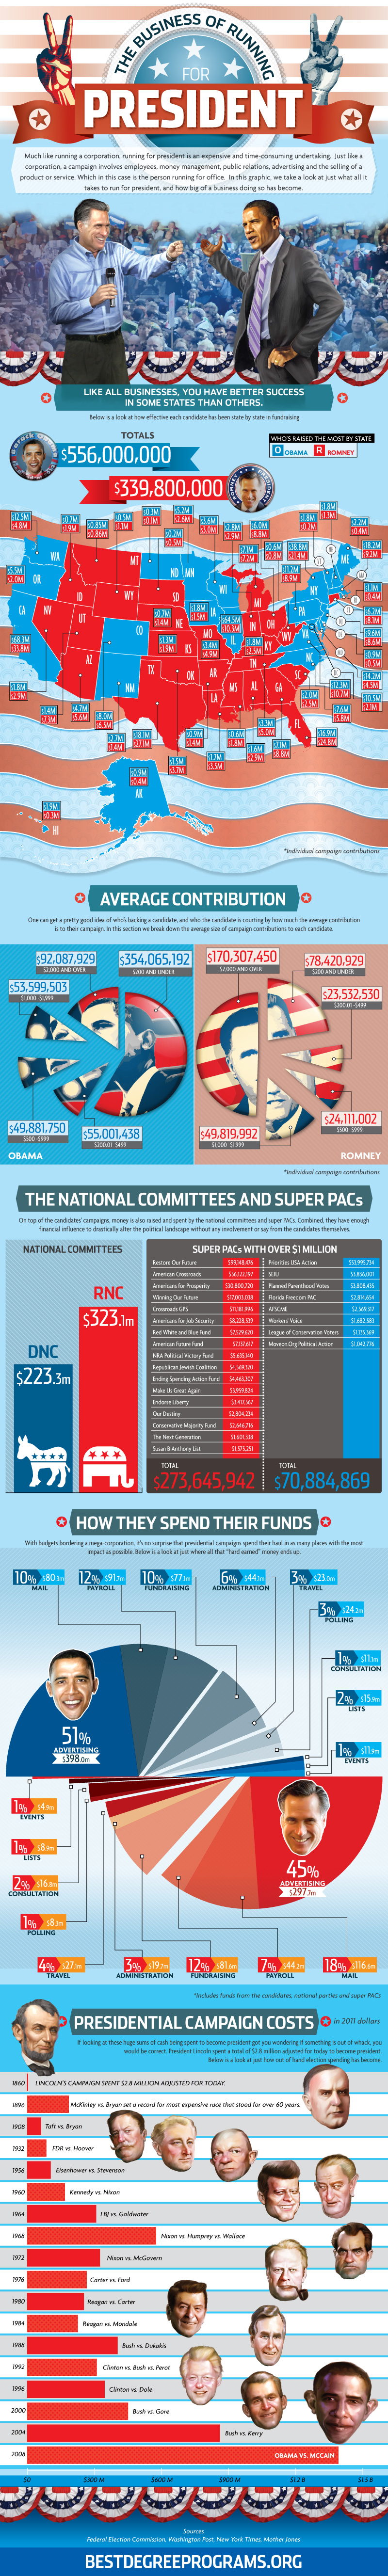
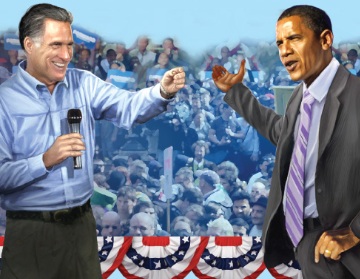
Much like running a corporation, running for president is an expensive and time-consuming undertaking. Just like a corporation, a campaign involves employees, money management, public relations, advertising and the selling of a product or service. Which in this case is the person running for office. In this graphic, we take a look at just what all it takes to run for president, and how big of a business doing so has become.
Like all businesses, you have better success in some states than others. Below is a look at how effective each candidate has been state by state in fundraising.
Contributions by state
– State – Obama – Romney
– Alabama – $1,654,274 – $2,955,243
– Alaska – $972,467 – $462,946
– Arizona – $4,735,019 – $5,618,326
– Arkansas – $914,689 – $1,412,499
– California – $68,370,488 – $33,894,034
– Colorado – $8,027,613 – $6,517,234
– Connecticut – $6,294,077 – $8,140,053
– Delaware – $992,752 – $584,135
– DC – $10,529,242 – $2,178,276
– Florida – $16,932,440 – $24,803,358
– Georgia – $7,120,899 – $8,862,459
– Hawaii – $1,931,175 – $393,309
– Idaho – $705,441 – $1,947,334
– Illinois – $64,534,584 – $10,327,299
– Indiana – $2,843,021 – $2,970,872
– Iowa – $1,858,402 – $1,554,544
– Kansas – $1,398,820 – $1,926,745
– Kentucky – $1,800,379 – $2,569,190
– Louisiana – $1,776,630 – $3,538,962
– Maine – $2,201,770 – $435,405
– Maryland – $14,233,717 – $4,546,946
– Massachusetts – $18,287,133 – $9,232,363
– Michigan – $7,149,288 – $7,276,333
– Minnesota – $5,254,806 – $2,642,940
– Mississippi – $664,000 – $1,859,956
– Missouri – $3,455,631 – $4,932,347
– Montana – $850,658 – $864,866
– Nebraska – $775,257 – $1,456,883
– Nevada – $1,890,065 – $2,905,250
– New Hampshire – $1,859,552 – $1,306,388
– New Jersey – $9,612,497 – $8,660,473
– New Mexico – $2,776,017 – $1,426,834
– New York – $38,838,996 – $21,478,660
– North Carolina – $7,619,320 – $5,832,134
– North Dakota – $364,751 – $195,090
– Ohio – $6,034,573 – $8,828,344
– Oklahoma – $1,540,354 – $3,710,800
– Oregon – $5,541,229 – $2,094,618
– Pennsylvania – $11,202,939 – $8,935,569
– Rhode Island – $1,116,206 – $487,904
– South Carolina – $2,008,461 – $2,558,859
– South Dakota – $289,204 – $559,960
– Tennessee – $3,392,185 – $5,069,581
– Texas – $18,139,449 – $27,176,411
– Utah – $1,493,890 – $7,360,437
– Vermont – $1,893,127 – $209,544
– Virginia – $12,341,283 – $10,714,153
– Washington – $12,517,534 – $4,864,403
– West Virginia – $629,025 – $801,053
– Wisconsin – $3,647,595 – $3,019,330
– Wyoming – $572,487 – $1,118,424
– Totals: Obama – $556,000,000; Romney – $339,800,000
*Individual campaign contributions
Average contribution
One can get a pretty good idea of whose backing a candidate, and who the candidate is courting by how much the average contribution is to their campaign. In this section we break down the average size of campaign contributions to each candidate.
Obama
– $200 and Under: $354,065,192
– $200.01 – $499: $55,001,438
– $500 – $999: $49,881,750
– $1000 – $1999: $53,599,503
– $2000 and Over: $92,087,929
Romney
– $200 and Under: $78,420,929
– $200.01 – $499: $23,532,530
– $500 – $999: $24,111,002
– $1000 – $1999: $49,819,992
– $2000 and Over: $170,307,450
*Individual campaign contributions
The Super PACs and National Committees
On top of the candidates’ campaigns, money is also raised and spent by the national committees and super PACs. Combined, they have enough financial influence to drastically alter the political landscape without any involvement or say from the candidate themselves.
– National committees – DNC–$223.3m RNC–$323.1m
– Super PACs with over $1 million
Republican
– Restore Our Future- $99,148,476
– American Crossroads – $56,122,197
– Americans for Prosperity – $30,800,720
– Winning Our Future – $17,003,038
– Crossroads GPS – $11,181,996
– Americans for Job Security – $8,228,539
– Red White and Blue Fund – $7,529,620
– American Future Fund – $7,137,617
– NRA Political Victory Fund – $5,635,140
– Republican Jewish Coalition – $4,569,320
– Ending Spending Action Fund – $4,463,307
– Make Us Great Again – $3,959,824
– Endorse Liberty – $3,417,567
– Our Destiny – $2,804,234
– Conservative Majority Fund – $2,646,716
– The Next Generation – $1,601,338
– Susan B Anthony List – $1,575,251
– Total – $273,645,942
Democrats
– Priorities USA Action – $53,995,734
– SEIU – $3,836,001
– Planned Parenthood Votes – $3,808,435
– Florida Freedom PAC – $2,814,654
– AFSCME – $2,569,317
– Workers’ Voice – $1,682,583
– League of Conservation Voters – $1,135,369
– Moveon.Org Political Action – $1,042,776
– Total – $70,884,869
How they spend their funds
With budgets bordering a mega-corporation, it’s no surprise that presidential campaigns spend their haul in as many places with the most impact as possible. Below is a look at just where all that “hard earned” money ends up.
– Obama % – Romney %
– Advertising – $457.6m (52%) – $356.8 (46%)
– Mail – $85.5m (10%) – $123.9m (16%)
– Payroll – $95.1m (11%) – $48.0m (6%)
– Fundraising – $81.8m (9%) – $90.7m (12%)
– Administration – $45.8m (5%) – $20.8m (3%)
– Travel – $24.1m (3%) – $31.4m (4%)
– Polling – $27.8m (3%) – $11.9m (1%)
– Consulting – $12.0m (1%) – $21.1m (3%)
– Lists – $16.3m (2%) – $9.0m (1%)
– Events – $13.9m (1%) – $5.6m (1%)
*Includes funds from candidates, national parties and super PACs
If looking at these huge sums of cash being spent to become president got you wondering if something is out of whack, you would be correct. President Lincoln spent a total of $2.8 million adjusted for today to become president. Below is a look at just how out of hand election spending has become.
– 1860: Lincoln’s campaign spends $2.8 million in today’s dollars
– 1896: McKinley vs. Bryan set a record for most expensive race that stood for over 60 years.
– 1908: Taft vs. Bryan
– 1932: FDR vs. Hoover
– 1956: Eisenhower vs. Stephenson
– 1960: Kennedy vs. Nixon
– 1964: LBJ vs. Goldwater
– 1968: Nixon vs. Humphrey vs. Wallace
– 1972: Nixon vs. McGovern
– 1976: Carter vs. Ford
– 1980: Reagan vs. Carter
– 1984: Reagan vs. Mondale
– 1988: Bush vs. Dukakis
– 1992: Clinton vs. Bush vs. Perot
– 1996: Clinton vs. Dole
– 2000: Bush vs. Gore
– 2004: Bush vs. Kerry
– 2008: McCain vs. Obama
SOURCES
Federal Election Commission, Washington Post, New York Times, Mother Jones